
Why Balance Needs More Than Playtesting
Making Games with AI · Part 10
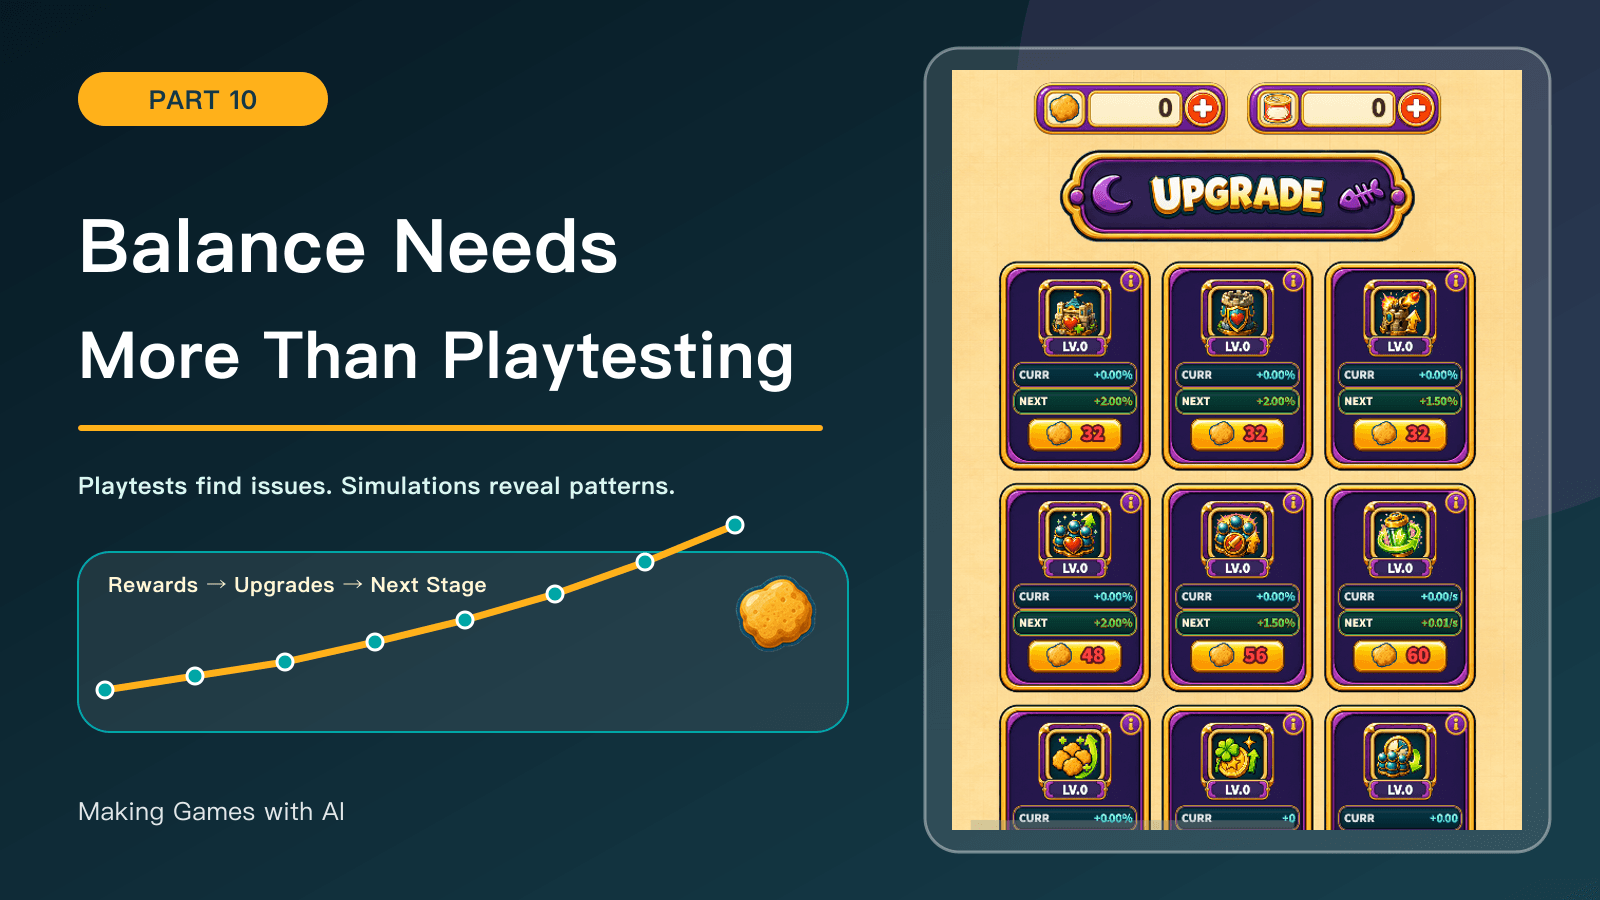
This article revisits development in June–July 2026 and early August, using records through August 2, 2026. References to “current” behavior, values, images, candidates, and validation describe that historical snapshot, not today's released game.
Previous: How Animation, Backgrounds, and Effects Enter the Game
Visual defects are often obvious: an action breaks, a layer is misplaced, or an effect appears in the wrong place. Balance problems can hide behind a vague impression that a level feels too difficult.
A developer already knows Kibble Street TD's unit relationships, summoning rhythm, and upgrade order. One success may reflect favorable choices and randomness; repeated losses may reflect an input mistake. A play session can identify a suspicious point without establishing the health of the whole progression curve.
The first step was therefore to define measurable questions: win rate, time to victory, when defeat occurred, remaining base health, affordable upgrades before the level, and repeated losses during sustained progression. The results below are from the August 2, 2026 configuration and simulations, not the current game's balance or real players.
One result is one sample
For Stage 8, the recorded test used a fixed ordinary-play model, the middle of the recommended upgrade range, no temporary items, and 100 simulations. It produced 37 wins and 63 losses. Median duration among wins was 277.7 seconds, against a target range of 125–200 seconds.
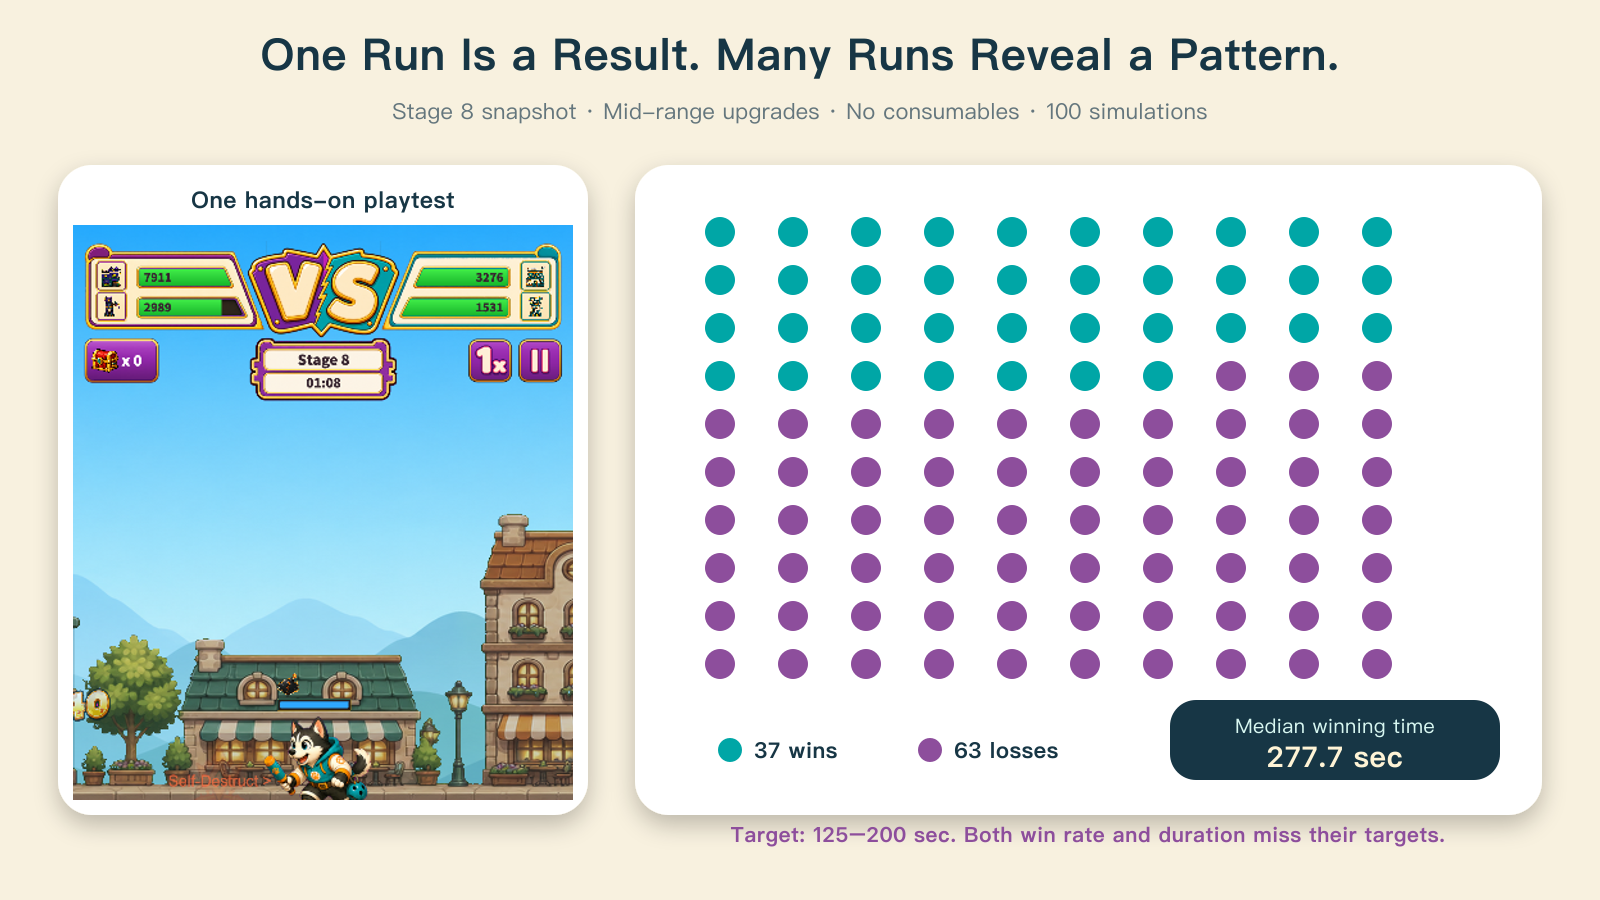
Testing only one of the wins could suggest that the level worked but ran slightly long. Testing one quick defeat could suggest excessive enemy attack. Together, the samples showed two issues: too few wins and excessively long successful battles.
Simulation did not know more than people about fun. It held conditions consistent and repeated the experiment. The human still defined an acceptable first-attempt success rate, a tiring battle length, and how many losses should precede a useful upgrade prompt.
Connect rewards, upgrades, and the next level
Difficulty depended on more than opposing health pools. KIBBLE earned after battle determined affordable upgrades, which determined the strength brought into the next level.
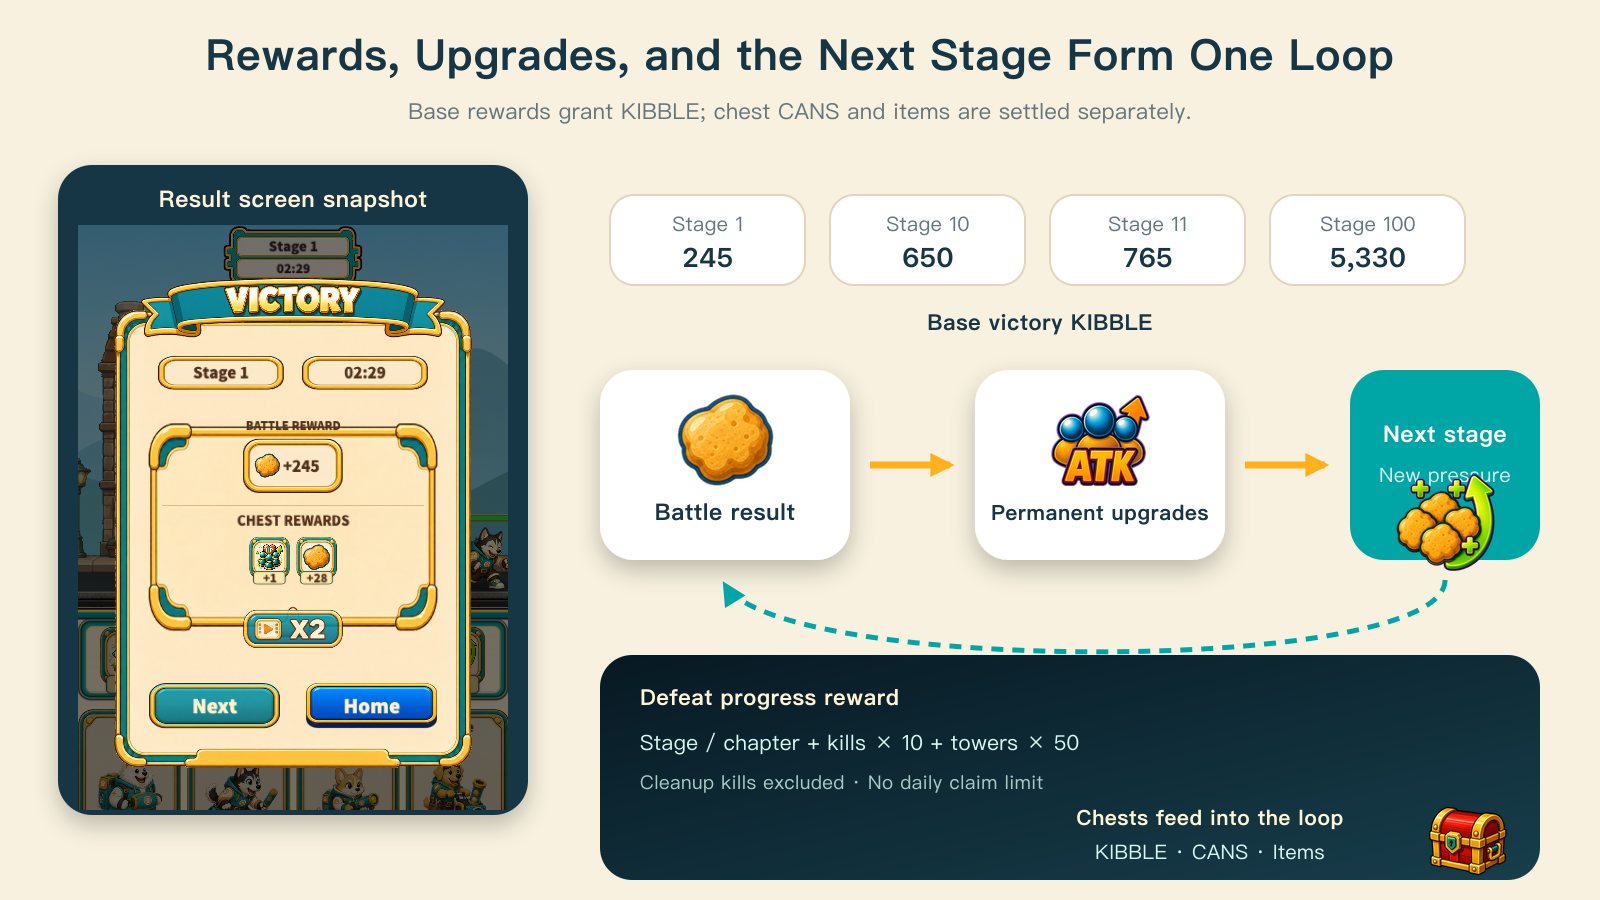
In this historical configuration, base victory rewards combined level and chapter progression: 245 KIBBLE at Stage 1, 650 at Stage 10, 765 at Stage 11 after entering a new chapter, and 5330 at Stage 100. Base victory rewards granted KIBBLE only. CANS and items came from separate sources such as chests, ads, and the shop.
Defeat rewards reflected what actually happened. Alongside stage and chapter progress, each defeated enemy contributed 10 KIBBLE and destroying the enemy tower contributed 50. Cleanup after settlement did not count, and defeat rewards had no daily claim limit.
The intention was to prevent a player who had made substantial progress from remaining permanently below an upgrade threshold. Too little income could trap progression; too much could make deliberate defeat the most efficient farming strategy. Both required examination across consecutive levels.
Upgrade cost is not an arbitrary straight line
The game then had nine upgrade tracks with different cost multipliers. Price combined a base value and linear, quadratic, and cubic level terms. Purchases from level 11 onward applied additional growth on top of that curve.
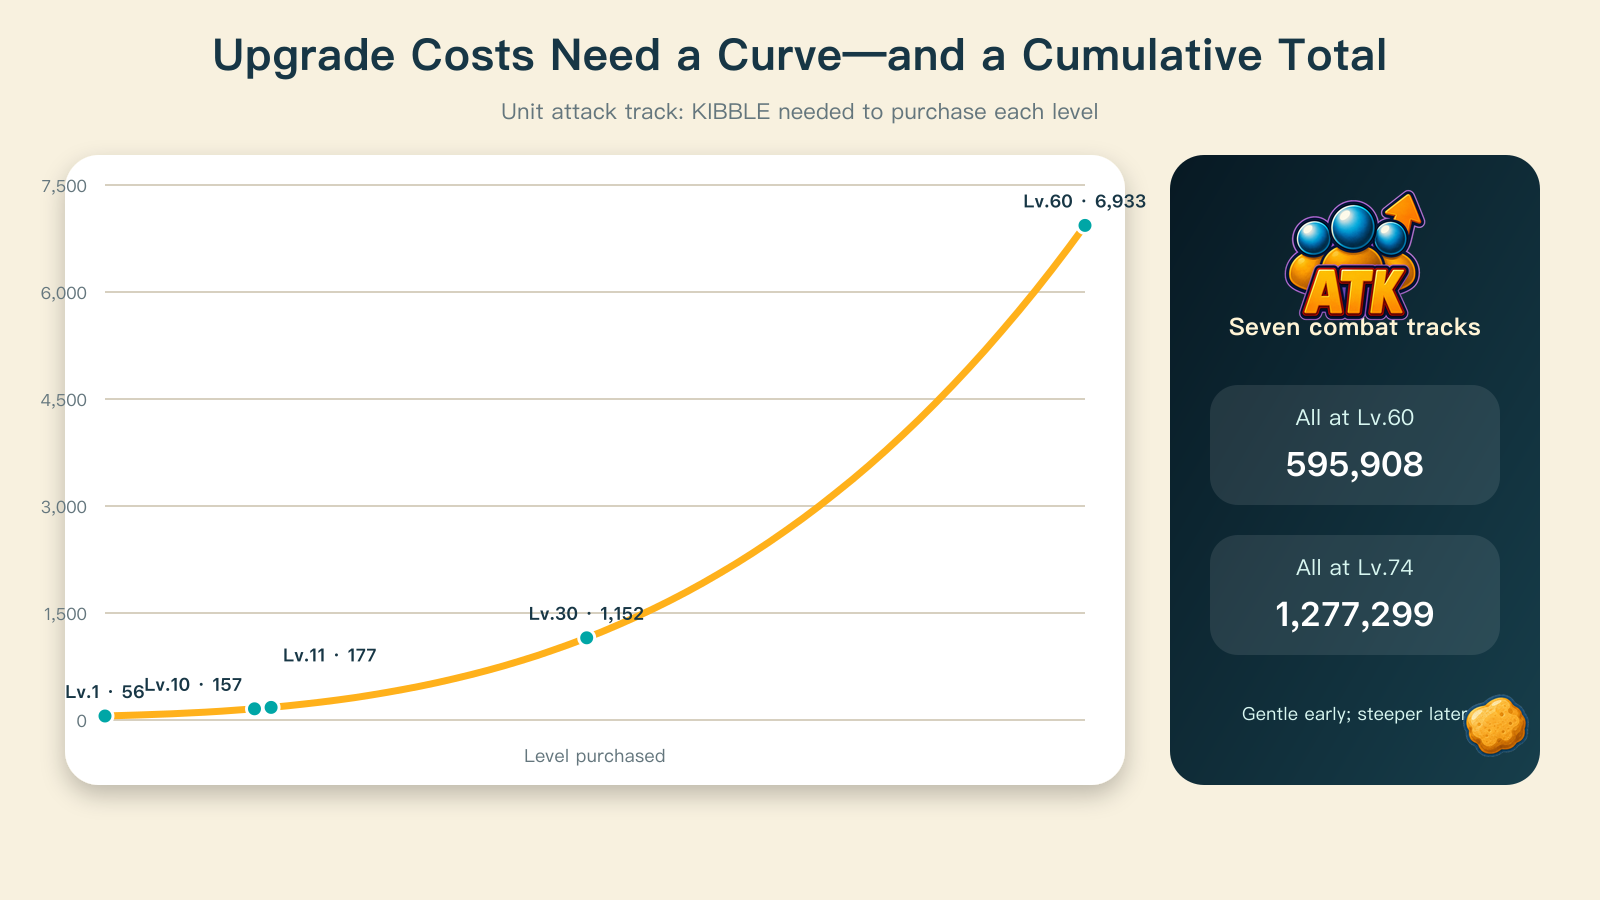
The gentler first ten levels introduced the relationship between fighting, earning, and improving. Later prices spread out to preserve choices in long-term growth. Raising the seven basic combat tracks to shared level 60 cost 595,908 KIBBLE in total; level 74 cost 1,277,299.
An isolated price could not establish affordability. The relevant comparison was income over time, purchase order, and cumulative spending. Could normal progress fund the recommended levels? Could defeat rewards shorten a blockage without removing meaningful tradeoffs?
Enemy strength needs one pressure source
Independent multipliers for unit health, unit attack, towers, bases, and spawn timing could accidentally compound. This implementation used two pressure targets instead: total health to handle per second and theoretical damage capacity introduced per second.
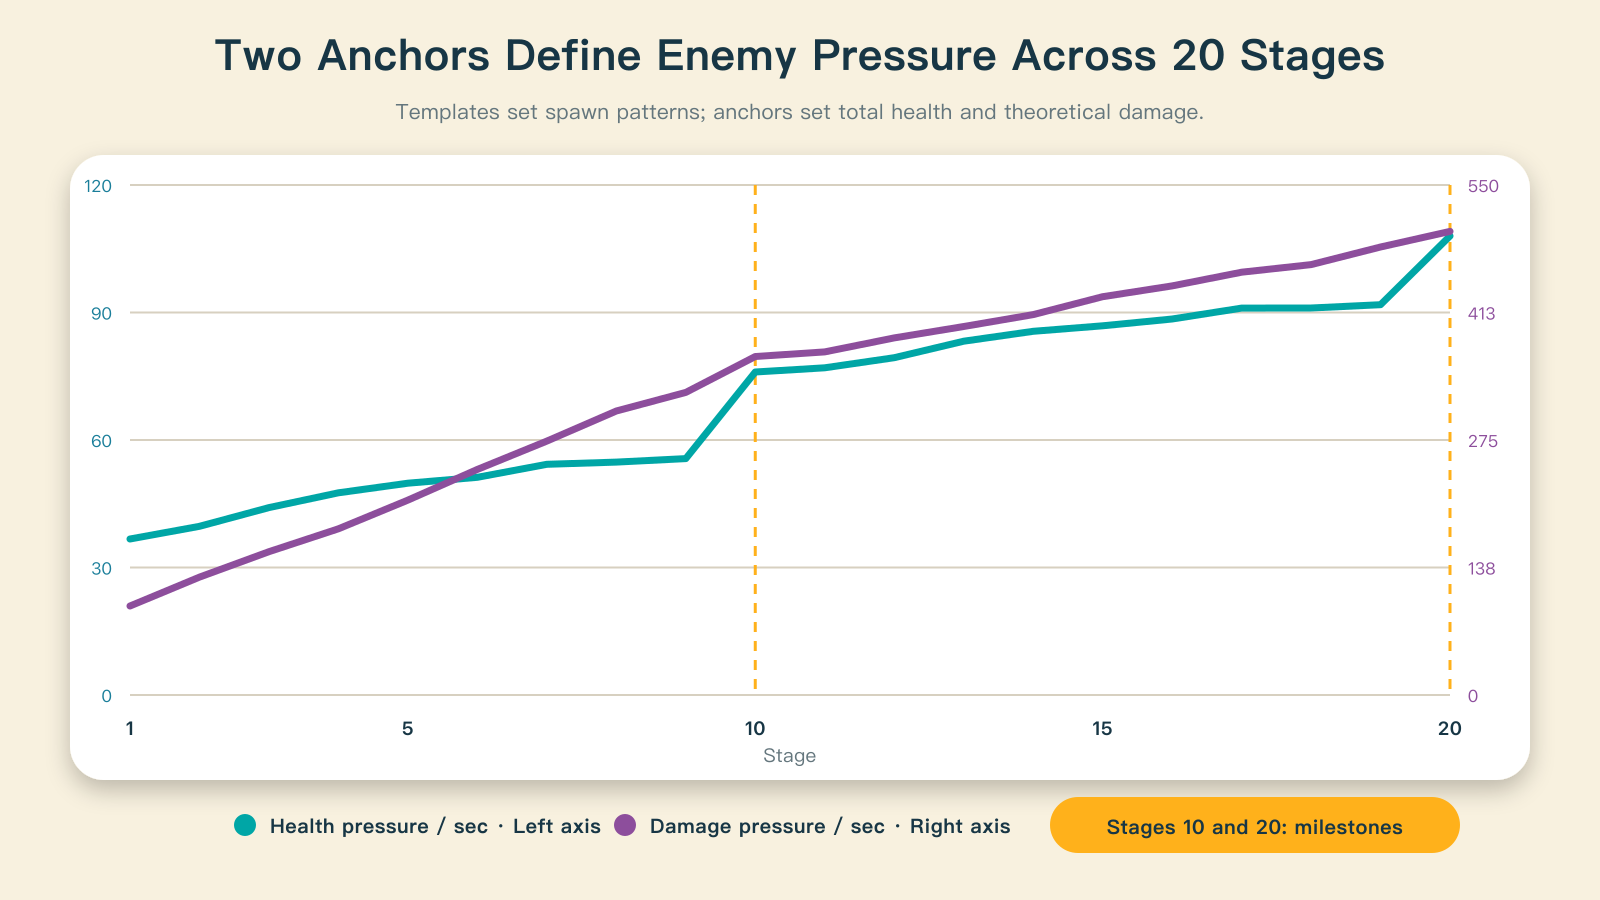
Level templates still controlled enemy types, counts, arrival times, and mechanic events. Pressure anchors converted the template into final health and attack scaling. Values between neighboring anchors used linear interpolation, without another hidden runtime difficulty multiplier.
The rises at Stages 10 and 20 worked with boss timelines to form progression gates. Changing a template required recalculating pressure: the same target combined with different units and arrival times could create different combat peaks.
Repeat a level at different upgrade investments
The test compared minimum, middle, and maximum recommended upgrades rather than assuming a few extra levels would fix everything. In the recorded 100-run, no-item samples, Stage 9 improved from a 21% win rate at the minimum to 86% at the maximum. Median winning duration fell from 281.7 to 159.4 seconds. Upgrades addressed much of that stage's pressure.
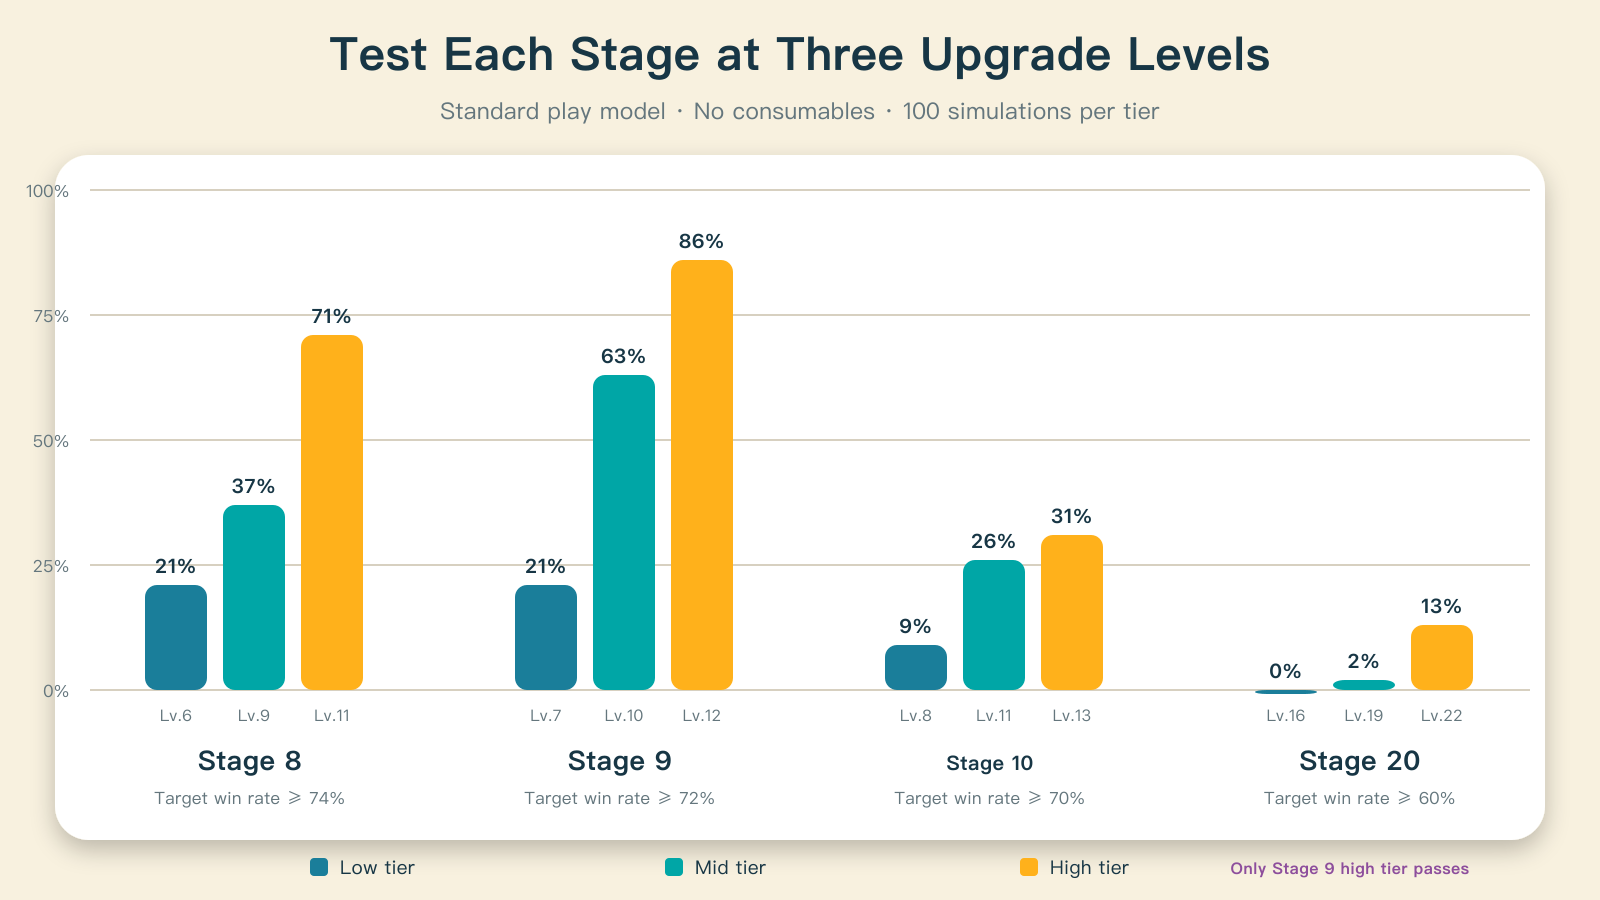
Stage 10 behaved differently: the three profiles won 9%, 26%, and 31% of their runs. Even the highest profile had a 289.4-second median among wins. The highest Stage 20 profile won only 13%. Those results pointed beyond affordability toward the interaction of bosses, timelines, the play model, and pressure targets.
Random samples can also change summoning and engagement patterns, so a higher level does not guarantee every measured statistic improves monotonically. Win rate, duration, failure causes, and uncertainty need to be read together.
Eventual completion is not enough
The next experiment connected Stages 1–20 using the ordinary-play model, no temporary items, and no ad rewards. All 30 simulated paths eventually cleared Stage 20. Yet they averaged 75.77 cumulative defeats, reached a longest losing streak of 41, and took an average 17.3 modeled calendar days, including 8.6 days waiting for resources.
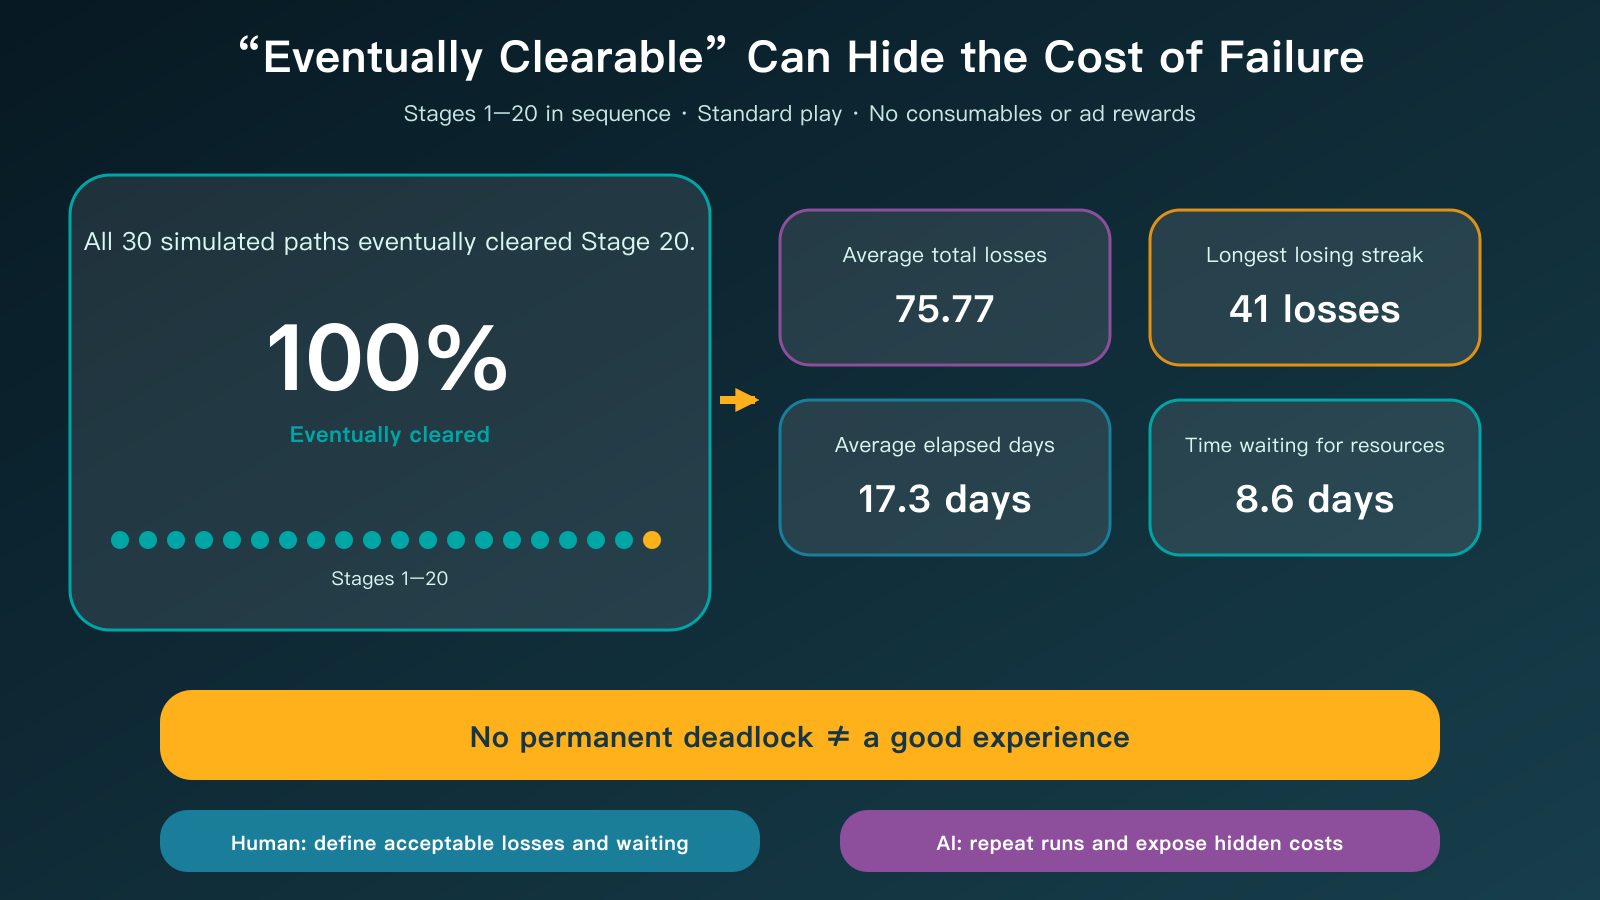
Recording only eventual completion would make that curve appear healthy. Adding the cost of getting there changed the conclusion. The model showed no permanent deadlock, but did not establish that the no-item campaign met the intended experience.
These were model outputs, not player data, and did not imply retention, revenue, or reviews. They exposed risks before release. Static checks could establish agreement among formulas, configuration, and references; they could not establish a good experience either.
Who is responsible for this part?
The human defines teaching levels, pressure checks, and major gates, along with acceptable success rates, durations, and losing streaks. They decide whether the baseline excludes items and ads, and when challenge becomes exhaustion.
AI reads the same runtime configuration, repeats selected play and upgrade models, summarizes results and economic costs, and checks for regressions after changes.
The historical conclusion was not that balance work had finished. Economic contracts were consistent, but the no-item campaign still missed explicit targets. The next changes needed to address pressure or timeline causes and rerun the same measures, rather than hide anomalies with runtime clamps.
Where to start
Define three targets for the first ten stages: win rate, battle duration, and expected upgrade level on entry. Choose a baseline without temporary items and run 100 trials per stage, recording at least wins, median winning time, failure cause, and remaining base health.
When a sharp discontinuity appears, change one source at a time: rewards, costs, pressure, or timeline. Then retest adjacent stages as well as the changed one. Data cannot choose what is fun, but it can prevent one successful playthrough from becoming an unsupported conclusion.